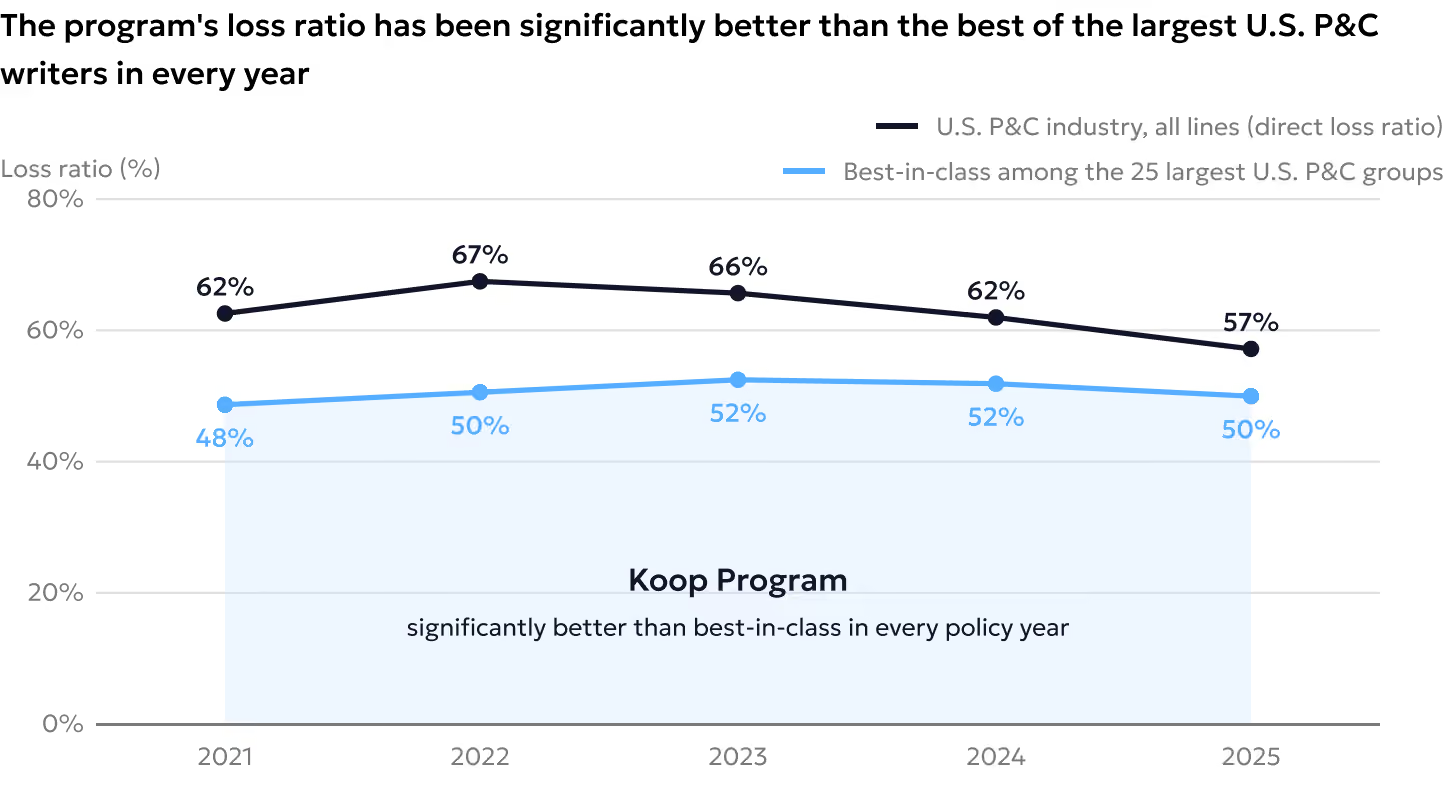
In every policy year the program's loss ratio has been significantly better than the best-in-class result among the 25 largest U.S. P&C groups (48–52% on all lines), against an industry average of 57–67%. The lines robots touch run worse still: commercial auto liability at 71%.
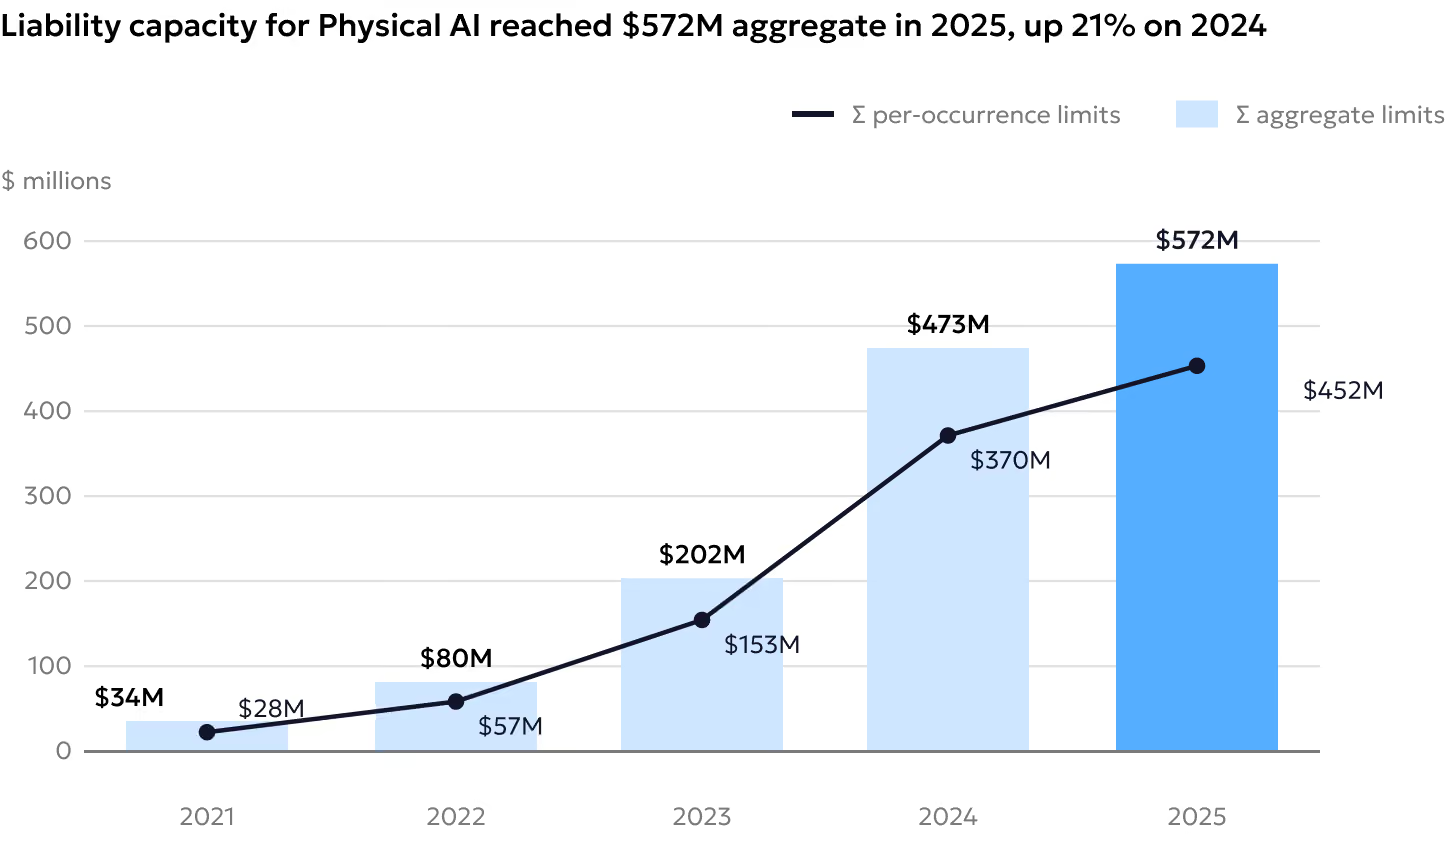
Aggregate liability limits deployed for robotics rose from $80M in 2022 to $572M in 2025, up 21% in the last year alone. Excess layers were the largest source of new capacity.
Premium per dollar of revenue in 2025 stood at 31% of its 2022 level. Price has stopped being the barrier to insuring robots; terms are where the friction moved.
With the autonomous mobile robot at 100, robotics software prices at 6, drones at 50, arms at 172, delivery at 191, and robots that clean, dig and move things in occupied spaces at 360–700.
Email compromise and social engineering incidents account for a third of all loss dollars. Incidents in which a member of the public was hurt account for 12%. Only 4% of companies have ever reported an incident.
Half of robot risks still carry a restriction, but exclusions fell from 42% to 29% of decisions, price adjustments rose from 11% to 36%, and outright declinations fell from 11% to 1%.
87% of applicants report a safe-stop system and 65% a safety framework. Companies reporting a control pay 25–65% less per dollar of revenue, yet only 6% publish a safety page. The terms discount is still on the table.
With 21 employees and 25 robots in the field; 40% are pre-revenue. One in three is headquartered in California.
Rates find a floor, excess and cyber grow with the fleets, warranties replace exclusions, and safety standards and compliance reports become underwriting inputs.
23 robot segments priced against each other, from software to earth-moving
Unlock the report32 states mapped, plus the sector, unit type and use case breakdowns
Unlock the report